Plugins
The data from the device-dependent drivers are first placed into a ring buffer whose size is defined in the constructor and configuration function.
The AveragingTime PV determines the time period over which to average the readings. The AveragingTime divided by the SampleTime determines the number of samples to average, NumAverage_RBV. When this number of samples have been accumulated in the ring buffer a separate thread copies them to 12 separate NDArrays and calls any registered plugins using the asyn addresses 0-11.
The NDArray dimensions are [NumAverage_RBV] for all addresses except address 11. For address 11 the dimensions are [11, NumAverage_RBV], because it contains all data items. The array datatypes are all epicsFloat64.
The plugins register for callbacks on a specific address which determines which data item they are passed.
The following table lists the addresses used for each data item.
Address |
Description |
|---|---|
0 |
Current 1 |
1 |
Current 2 |
2 |
Current 3 |
3 |
Current 4 |
4 |
SumX |
5 |
SumY |
6 |
SumAll |
7 |
DiffX |
8 |
DiffY |
9 |
PositionX |
10 |
PositionY |
11 |
All above data in an array [11, NumAverage_RBV] |
The example IOCs provided with quadEM load the file iocBoot/quadEM_Plugins.cmd. This file first loads ADCore/iocBoot/commonPlugins.cmd, the same plugins that are loaded for all areaDetector drivers. This includes PVA, ROIs, HDF5, TIFF, etc. It then loads an additional set of plugins from ADCore configured specifically for the quadEM application.
Plugin type |
Record prefixes |
Description |
|---|---|---|
NDPluginStats |
$(P)$(R)Current[1-4]: |
Statistics for the current values. The average value is $(P)$(R)Current[1-4]:MeanValue_RBV. Many other statistics are available, including the minimum, maximum, standard deviation, and histogram of values. |
NDPluginStats |
$(P)$(R)Sum[X,Y,All]: |
Statistics for the sum of currents 1+2, 3+4, and 1+2+3+4. The average value is $(P)$(R)Sum[X,Y,All]:MeanValue_RBV. Many other statistics are available, including the minimum, maximum, standard deviation, and histogram of values. |
NDPluginStats |
$(P)$(R)Diff[X,Y]: |
Statistics for the differences of current 2-1 and 4-3. The average value is $(P)$(R)Diff[X,Y]:MeanValue_RBV. Many other statistics are available, including the minimum, maximum, standard deviation, and histogram of values. |
NDPluginStats |
$(P)$(R)Pos[X,Y]: |
Statistics for the positions. The average value is $(P)$(R)Pos[X,Y]:MeanValue_RBV. Many other statistics are available, including the minimum, maximum, standard deviation, and histogram of values. |
NDPluginTimeSeries |
$(P)$(R)TS: |
Plugin that receives NDArray callbacks of dimension [11,NumAveraged_RBV] and forms 11 different time-series arrays. This plugin provides a time-history (like a digital scope) of the current, sum, difference and position at speeds up to 20000Hz (TetrAMM), 6510 Hz (AH501 series), 1000Hz (AH401 series). The time per point can be greater than the sampling time, in which case it does averaging. The time series can operate in a fixed-length mode where acquisition stops after the specified number of time points have been collected. This mode is suited for data-acquisition applications, such as on-the-fly scanning. The time series plugin can also operate in a circular buffer mode with continuous acquisition and display of the most recent |
NDPluginFFT |
$(P)$(R)FFT[1-11]: |
Plugin that receives the time-series arrays from the NDPluginTimeSeries plugin and computes the frequency power-spectrum of each signal. This plugin can also average the FFTs to improve the signal/noise ratio. |
Note that the first time the IOC is started all of the plugins will have EnableCallbacks=Disable. It is necessary to enable each of the plugins that will be used. The value of EnableCallbacks is saved by autosave, and will be restored the next time the IOC is started.
This is the medm screen for all of the plugins defined in quadEM_Plugins.cmd.

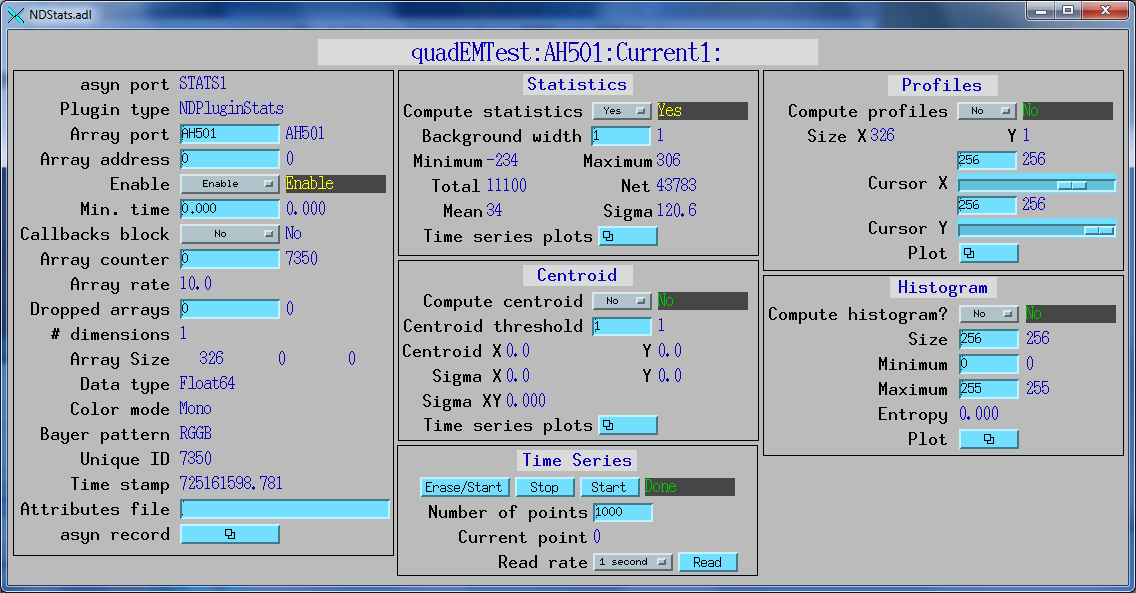
This is the medm screen for the Current1: NDPluginStats plugin loaded by commonPlugins.cmd.
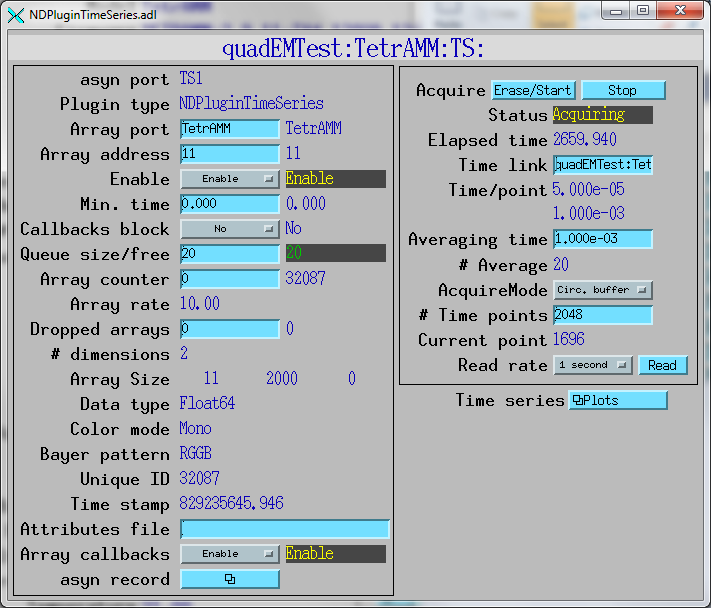
This is the medm screen to control the NDPluginTimeSeries plugin. In this example the time per point from the TetrAMM is 50 microseconds, and averaging time for the time series plugin is 1 millisecond, or 20 points. The plugin has 2000 time points, and is operating in circular buffer mode.
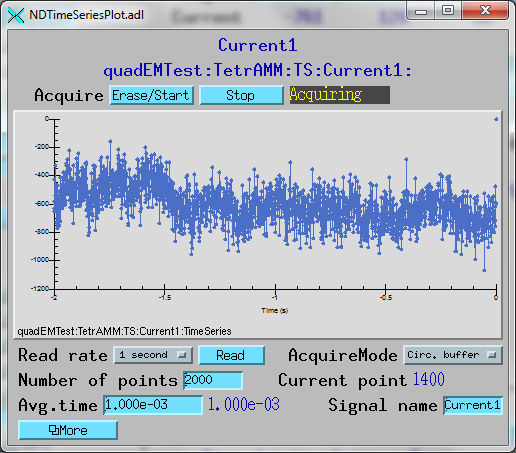
This is a plot of the time series for Current 1. It shows the last 2 seconds of data in circular buffer mode.
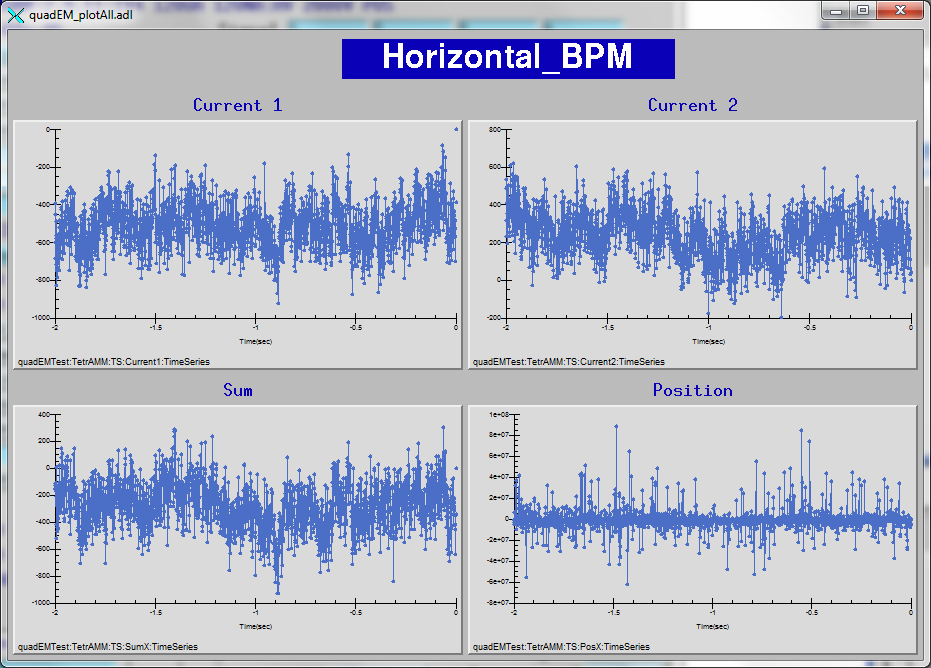
This is a plot of the time series for the horizontal currents, sum, and position. It shows the last 2 seconds of data in circular buffer mode.
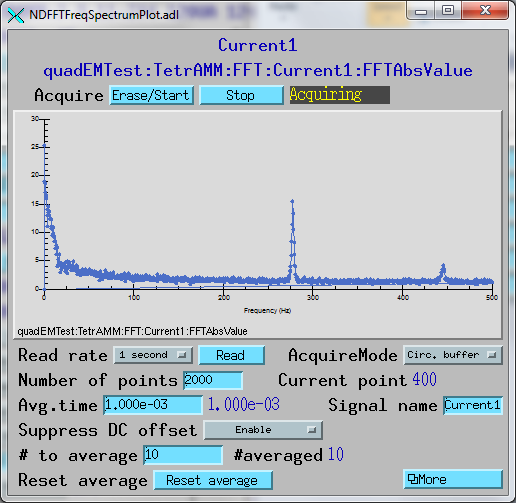
This is a plot of the FFT for Current 1. DC offset suppression is enabled and 10 FFTs are being averaged to improve the signal/noise ratio.
This is an medm screen for control of all 11 FFT plugins.

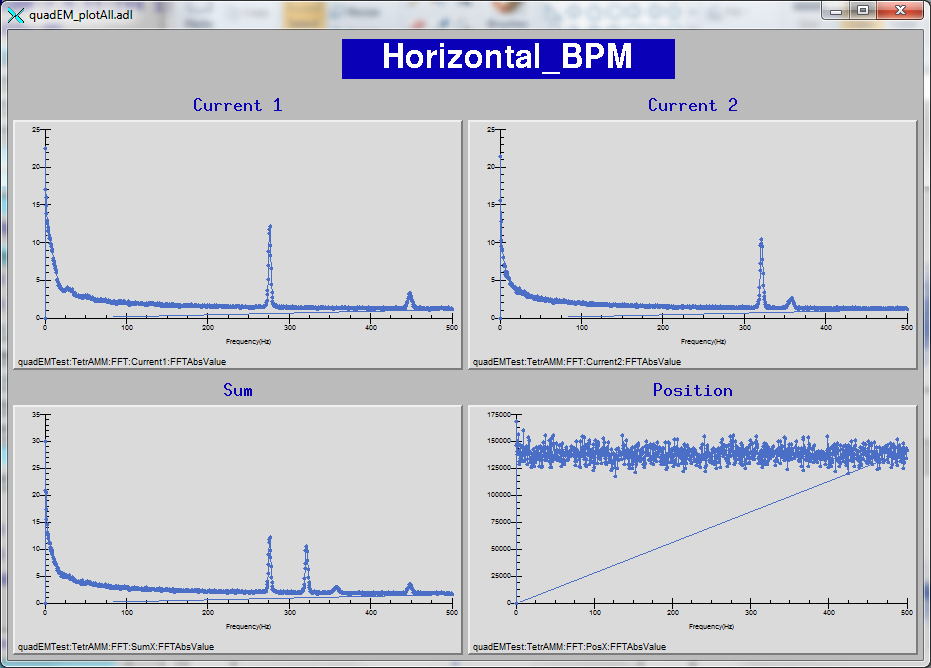
This is an medm screen that displays the FFTs of the Current, Sum, and Position for the time-series data above. 100 FFTs are being averaged to improve the signal/noise ratio.